
SCAN
Diagnosis
We audit sources, data quality and current reporting, and map the decisions each team needs to make.

SERVICES — STRATEGY & BI
A dashboard isn't for looking at: it's for deciding.
We connect your data sources —platforms, analytics, CRM, back-office— and turn them into decision-oriented dashboards: a single version of the truth, with the metrics each team actually cares about.
SHALL WE TALK?Business Intelligence (BI) and data visualization are the work of connecting a business’s data sources —marketing, sales, operations— and turning them into dashboards that support decisions. At Bravante we put it at the service of running the business: fewer charts and more answers, with a single version of the truth shared by every team.
We work with ecommerce, SaaS and lead-generation businesses whose data lives scattered across platforms, spreadsheets and tools that don’t talk to each other: management wants to see the business at a glance and each team needs its levers. If you’re looking for a decorative dashboard, we’re not your team; if you’re looking for ordered data to decide faster, let’s talk.
When every team produces its own number, meetings are about reconciling figures instead of deciding. A shared metrics model ends that argument.
The information that today takes days to assemble in a spreadsheet, available when you open the browser. Decision speed is a competitive advantage too.
Marketing, sales and operations share the same map: you see which channel brings margin, not just which channel brings clicks.
Second opinion
We review your dashboards and the sources feeding them and tell you what we find: what answers real decisions, what doesn't, and whether it makes sense to work together. No commitment, no sales theatre.
What we'll do
What sources you have, what reporting exists and what decisions each team needs to make: the real starting point.
Single, shared definitions of every metric —what counts as a sale, a lead, CAC— to end the 'every team has its own number'.
We connect marketing platforms, analytics, CRM and back-office into a coherent data model.
Dashboards per audience: management, marketing and operations each see what they need, without noise.
Automatic refresh and alerts: your team's time goes to deciding, not to copy-pasting data.
A dashboard nobody looks at is useless: we work with the teams so data enters the decision routine.
Where we build
The agile option in the Google ecosystem: dashboards connected to GA4, Ads and Sheets, with no licence cost.
Microsoft's corporate standard: powerful modelling and data governance for management reporting.
Advanced visualization for teams that demand analytical depth and free exploration of the data.
Product analytics: funnels, retention and in-app behaviour, joined up with the rest of the reporting.
The data warehouse where we consolidate sources when volume or cross-analysis calls for it.
ETL and APIs to bring each platform's data into the model automatically, no copy-paste.
How we work it
Applied to BI & Data Visualization
SCAN
Diagnosis
We audit sources, data quality and current reporting, and map the decisions each team needs to make.

BUILD
Model & design
We define the metrics model, the integrations and the design of each dashboard, prioritizing with an ICE matrix.

RUN
Implementation
We connect the sources, build the dashboards and validate the data against business reality.

VALIDATE
Adoption & evolution
We measure real usage, gather feedback and evolve the reporting with the business's new questions.
Ecommerce SaaS & Tech Health Insurance Education Legal Food & Beverage Fashion Professional services
From scale-up to multinational the pattern repeats: clear model and potential to scale. The industry matters less than the economics of the business.








ACTIONS, NOT WORDS
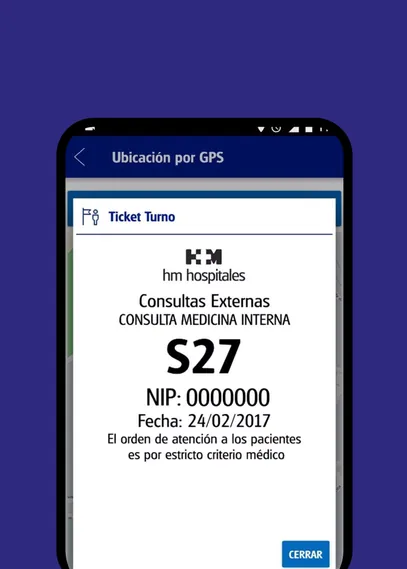
HM Hospitales
HEALTH
APP
Digital analytics measures what happens in your channels; BI joins that data with the rest of the business —sales, margins, operations— and turns it into dashboards for decision-making. They go hand in hand: without good measurement there is no good BI.
Looker Studio, Power BI or others in the ecosystem: the tool is chosen to fit your case and your team, not the other way round. The hard part —and where we add value— is the metrics model and the data quality, not the chart.
Usually for one of three reasons: the data isn't trustworthy, the metrics don't answer real decisions, or there's too much noise. A useful dashboard starts from the question it answers, not from the charts it shows.
It depends on the state of your sources, but we work in phases: a first useful dashboard within weeks and evolution from there, rather than a months-long project that arrives late.
Both, with different views: management needs the picture of the business; each team, its operational levers. The metrics model is shared; the view is per audience.
Diagnosis, roadmap and investment projection so every channel answers to a business goal.
SEE SERVICE→Reliable, decision-oriented measurement: from the tags to the dashboard management looks at.
SEE SERVICE→Operational diagnosis, redesign and automation with applied AI: efficiency measured in hours, errors and margin.
SEE SERVICE→Planning, execution and optimization of your advertising investment with a business-first approach.
SEE SERVICE→Organic positioning in search engines and generative (AI) engines, with a business-first approach.
SEE SERVICE→Conversion optimization through experiments: more results from the traffic you already have.
SEE SERVICE→Email, CRM, processes and automated flows that turn your database into recurring revenue.
SEE SERVICE→Ask us for a proposal, opinion or coffee
Are you ready to grow? Let's talk.